the Case is updated.
Consumer price index ended down 0.1 per cent in January after falling 0.5 percent in December, which reduced annual growth from 3.5 per cent in December to 2.8 percent in January.
It shows fresh figures from Statistics norway (SSB).
Core inflation, which measures inflation adjusted for energy prices and tax changes, fell 0.5 per cent in January, after falling 0.4 per cent in December. Thus, the lowered annual growth from 2.5 per cent in December to 2.1 per cent in January.
In December, there was food and electricity prices, which lowered inflation, but in January there was the offer on the clothes and furniture which pulled the price down, according to STATISTICS norway. Increased gas – and dieselpriser contributed most in the other direction. Here the prices have increased a lot because of the increased fees from the new year.
January is traditionally characterized by tilbudsaktivitet within these industries, type SSB about clothing and møbelprisene.
– Klesprisene fell 9.6 per cent, and there was a measured decrease in most categories. The prices of furniture and interior and ornamental went down 9.7 per cent. Skoprisene fell 6.3 per cent in the same period, type SSB further, and adds that the prices of package holidays are down to 4.0 percent in January.
Inflasjonstallene for January, well below experts ‘ prediction, and especially if one looks at core inflation.
DNB Markets expected in advance that the consumer would end with an annual growth of 3.1 per cent in January, while konsensusforventningen lay at 3.0 per cent.
Brokers expected that core inflation would be unchanged in January, with an annual growth of 2.6 per cent. Konsensusforventningen was an increase of 0.1 percent and an annual growth of 2.6 per cent.
Lower than the central bank’s prediction
chief economist Kjetil Olsen in Nordea Markets pointed out in a comment ahead of figures on Friday morning that they were expecting a kjerneinflasjon of 2.6 per cent (0.1 percentage points more than the answer key showed), and that this was 0.3 points below the Norges Bank has assumed.
In December was core inflation 0.4 percentage points below Norges Bank’s estimate, according to Olsen.
– the Uncertainty around the estimate this time is related to about rising food prices has picked up again after the large cuts in December (…) In February estimates Norges Bank kjerneinflasjon of 2.5 per cent, we therefore believe the gap limited further in the months ahead, he writes, and adds that inflation could not stand at the top of the agenda on the Bank a day, even if they’re steered by a long-term inflation target.
Much more expensive fuel
In the inflation report points out STATISTICS that the cost of food rose by 0.6 per cent, after they fell in the five preceding months in a row.
It was particularly the chocolate and confectionery who were behind this increase, which again is due to increase after tilbudskampanjer in December, writes the REVISION.
The really big price increases for Norwegian consumers was however not in the store, but by bensinpumpen. The increase in fuel prices was the main contributor up for the consumer price index in January.
– the Prices of gasoline and auto diesel has risen gradually over the last three months with the largest change in January, where they increased by 6,0 and 6,8 per cent. Prisoppgangene must among other things be seen in the context of the tax changes.
As is well known, as adopted by the government and samarbeidspartiene the Left and the christian democratic party has an increase in drivstoffavgiftene from the new year, an increase that led to a public avgiftskrangel last fall.
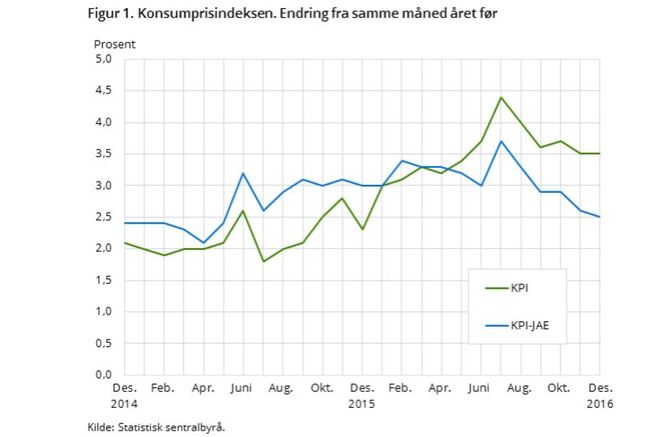 the Graph is taken from statistics norway’s inflation report for January. It shows the evolution in the consumer price index (in green) and core inflation (in green, adjusted for energy prices and tax changes) since December 2014.
- Share on Facebook
- Share on LinkedIn
Share on Twitter
No comments:
Post a Comment